|
UDC 697.9 Determination of coefficients of local resistance of tees in ventilation systems O. D. Samarin, Candidate of Technical Sciences, Associate Professor (NRU MGSU) The current situation with the determination of the values of the coefficients of local resistance (LCR) of the elements of ventilation networks in their aerodynamic calculation is considered. An analysis of some modern theoretical and experimental works in the area under consideration is given, and the shortcomings of the existing reference literature regarding the convenience of using its data for engineering calculations using MS Excel spreadsheets are identified. The main results of the approximation of available tables for CMS unified tees on a branch at discharge and suction in ventilation and air conditioning systems are presented in the form of appropriate engineering formulas. An assessment of the accuracy of the obtained dependences and the permissible range of their applicability is given, as well as recommendations for their use in the practice of mass design. The presentation is illustrated with numerical and graphical examples. Keywords:coefficient of local resistance, tee, branch, discharge, suction. |
UDC 697.9 Determination of local resistance coeffi cients of tees in ventilating systems O. D. Samarin, PhD, Assistant Professor, National Research Moscow State University of Civil Engineering (NR MSUCE) The current situation is reviewed with the definition of values of coeffi cients of local resistances (CLR) of elements of the ventilation systems at their aerodynamic calculation. The analysis of some contemporary theoretical and experimental works in this field is given and defi ciencies are identifi ed in the existing reference literature for the usability of its data to perform engineering calculations using MS Excel spreadsheets. The main results of approximation of the existing tables to the CLR for the uniform tees on the branch of the injection and the suction in the ventilating and air-conditioning systems are presented in the appropriate engineering formulas. The estimation of accuracy of the obtained dependencies and valid range of their applicability are given, as well as recommendations for their use in practice mass design. The presentation is illustrated by numerical and graphical examples. keywords:coefficient of local resistance, tee, branch, injection, suction. |
When the air flow moves in the air ducts and channels of ventilation and air conditioning systems (V and KV), in addition to pressure losses due to friction, losses on local resistances play a significant role - shaped parts of air ducts, air distributors and network equipment.
Such losses are proportional to the dynamic pressure R q = ρ v² / 2, where ρ is the air density, approximately equal to 1.2 kg / m³ at a temperature of about +20 ° C; v— its speed [m/s], determined, as a rule, in the section of the channel behind the resistance.
The coefficients of proportionality ξ, called local resistance coefficients (LCCs), for various elements of the B and KV systems are usually determined from tables available, in particular, in and in a number of other sources. The greatest difficulty in this case is most often the search for KMS for tees or branch nodes. The fact is that in this case it is necessary to take into account the type of tee (for passage or branch) and the mode of air movement (forcing or suction), as well as the ratio of air flow in the branch to the flow in the trunk L´ o \u003d L o /L c and cross-sectional area of the passage to the cross-sectional area of the trunk F´ p \u003d F p / F s.
For suction tees, it is also necessary to take into account the ratio of the cross-sectional area of the branch to the cross-sectional area of \u200b\u200bthe trunk F´ o \u003d F o / F s. In the manual, the relevant data are given in Table. 22.36-22.40. However, when performing calculations using Excel spreadsheets, which is currently quite common due to the wide use of various standard software and the convenience of processing calculation results, it is desirable to have analytical formulas for CMR, at least in the most common ranges of changes in the characteristics of tees .
In addition, it would be advisable in the educational process to reduce technical work students and transferring the main load to the development constructive solutions systems.
Similar formulas are available in such a fairly fundamental source as, but there they are presented in a very generalized form, without taking into account the design features of specific elements of existing ventilation systems, and also use a significant number additional options and require in some cases access to certain tables. On the other hand, appearing in recent times programs for automated aerodynamic calculation of systems B and KV use some algorithms to determine the CMR, but, as a rule, they are unknown to the user and therefore may raise doubts about their validity and correctness.
Also, some works are currently appearing, the authors of which continue research to refine the calculation of the CMR or expand the range of parameters of the corresponding element of the system, for which the results obtained will be valid. These publications appear both in our country and abroad, although in general their number is not too large, and are based mainly on numerical modeling of turbulent flows using a computer or on direct experimental studies. However, the data obtained by the authors, as a rule, is difficult to use in the practice of mass design, since they are not yet presented in engineering form.
In this regard, it seems appropriate to analyze the data contained in the tables and obtain, on their basis, approximation dependences that would have the simplest and most convenient form for engineering practice, and at the same time adequately reflect the nature of the existing dependences for CMR tees. For their most common varieties - tees in the passage (unified branch nodes) given task was solved by the author in the work. At the same time, it is more difficult to find analytical relationships for tees on a branch, since the dependencies themselves look more complicated here. General form approximation formulas, as always in such cases, is obtained based on the location of the calculated points on the correlation field, and the corresponding coefficients are selected by the least squares method in order to minimize the deviation of the constructed graph using Excel. Then for some of the most commonly used ranges F p / F s, F o / F s and L o / L s expressions can be obtained:
at L´ o= 0.20-0.75 and F´ o\u003d 0.40-0.65 - for tees during injection (supply);
at L´ o = 0,2-0,7, F´ o= 0.3-0.5 and F´ n\u003d 0.6-0.8 - for tees with suction (exhaust).
The accuracy of dependences (1) and (2) is shown in Figs. 1 and 2, which shows the results of processing table. 22.36 and 22.37 for KMS unified tees (branch nodes) on a branch of circular cross section during suction. In the case of a rectangular section, the results will differ insignificantly.

It can be noted that the discrepancy here is greater than for tees per pass, and averages 10-15%, sometimes even up to 20%, but for engineering calculations this may be acceptable, especially given the obvious initial error contained in the tables, and simultaneous simplification of calculations when using Excel. At the same time, the relations obtained do not require any other initial data, except for those already available in the aerodynamic calculation table. Indeed, it must explicitly indicate both the air flow rates and the cross-sections in the current and in the neighboring section, which are included in the listed formulas. First of all, this simplifies calculations when using Excel spreadsheets. At the same time Fig. 1 and 2 make it possible to verify that the found analytical dependencies quite adequately reflect the nature of the influence of all the main factors on the CMR of tees and the physical nature of the processes occurring in them during the movement of the air flow.

At the same time, the formulas given in this paper are very simple, clear and easily accessible for engineering calculations, especially in Excel, as well as in the educational process. Their use makes it possible to abandon the interpolation of tables while maintaining the accuracy required for engineering calculations, and directly calculate the coefficients of local resistance of tees on a branch in a very wide range of ratios of cross sections and air flow rates in the trunk and branches.
This is quite enough for the design of ventilation and air conditioning systems in most residential and public buildings.
- Designer's Handbook. Internal sanitary devices. Part 3. Ventilation and air conditioning. Book. 2 / Ed. N.N. Pavlov and Yu.I. Schiller. - M.: Stroyizdat, 1992. 416 p.
- Idelchik I.E. Handbook of hydraulic resistance / Ed. M.O. Steinberg. - Ed. 3rd. - M.: Mashinostroenie, 1992. 672 p.
- Posokhin V.N., Ziganshin A.M., Batalova A.V. To determine the coefficients of local resistances of disturbing elements of pipeline systems // Izvestiya vuzov: Stroitel'stvo, 2012. No. 9. pp. 108–112.
- Posokhin V.N., Ziganshin A.M., Varsegova E.V. To the calculation of pressure losses in local resistances: Soobshch. 1 // News of universities: Construction, 2016. No. 4. pp. 66–73.
- Averkova O.A. Experimental study of separated flows at the entrance to the suction holes // Vestnik BSTU im. V.G. Shukhov, 2012. No. 1. pp. 158–160.
- Kamel A.H., Shaqlaih A.S. Frictional pressure losses of fluids flowing in circular conduits: A review. SPE Drilling and Completion. 2015. Vol. 30. No. 2.Pp. 129–140.
- Gabrielaitiene I. Numerical simulation of a district heating system with emphases on transient temperature behavior. Proc. of the 8th International Conference “Environmental Engineering”. Vilnius. VGTU Publishers. 2011 Vol. 2.Pp. 747–754.
- Horikiri K., Yao Y., Yao J. Modeling conjugate flow and heat transfer in a ventilated room for indoor thermal comfort assessment. Building and Environment. 2014. No. 77.Pp. 135–147.
- Samarin O.D. Calculation of local resistances in ventilation systems of buildings // Journal of S.O.K., 2012. No. 2. pp. 68–70.
Aerodynamic calculation of air ducts begins with drawing an axonometric diagram (M 1: 100), putting down the numbers of sections, their loads L (m 3 / h) and lengths I (m). The direction of the aerodynamic calculation is determined - from the most remote and loaded section to the fan. When in doubt, when determining the direction, all possible options are calculated.
The calculation starts from a remote section: the diameter D (m) of a round or the area F (m 2) of the cross section of a rectangular duct is determined: 

Table. Required hourly fresh air consumption, m 3 / h (cfm)
According to Appendix H, they take the nearest standard values: D st or (a x b) st (m).
Actual speed (m/s):  or
or 
Hydraulic radius of rectangular ducts (m): 
Reynolds criterion: Re = 64100 x D st x U fact (for rectangular ducts D st = D L).
Hydraulic friction coefficient: λ = 0.3164 x Re - 0.25 at Re ≤ 60000, λ = 0.1266 x Re - 0.167 at Re  where is the sum of the local resistance coefficients in the duct section.
Local resistances at the border of two sections (tees, crosses) are attributed to the section with a lower flow rate. Local resistance coefficients are given in the appendices.
Scheme of the supply ventilation system serving a 3-storey administrative building.
Table 1. Aerodynamic calculation
| No. of plots | supply L, m 3 / h | length L, m | U re k, m/s | section a x b, m | U f, m/s | D l , m | Re | λ | kmc | losses in the area? p, pa |
| outlet PP grate | 0.2 x 0.4 | 3,1 | - | - | - | 1,8 | 10,4 | |||
| 1 | 720 | 4,2 | 4 | 0.2 x 0.25 | 4,0 | 0,222 | 56900 | 0,0205 | 0,48 | 8,4 |
| 2 | 1030 | 3,0 | 5 | 0.25 x 0.25 | 4,6 | 0,25 | 73700 | 0,0195 | 0,4 | 8,1 |
| 3 | 2130 | 2,7 | 6 | 0.4 x 0.25 | 5,92 | 0,308 | 116900 | 0,0180 | 0,48 | 13,4 |
| 4 | 3480 | 14,8 | 7 | 0.4 x 0.4 | 6,04 | 0,40 | 154900 | 0,0172 | 1,44 | 45,5 |
| 5 | 6830 | 1,2 | 8 | 0.5 x 0.5 | 7,6 | 0,50 | 234000 | 0,0159 | 0,2 | 8,3 |
| 6 | 10420 | 6,4 | 10 | 0.6 x 0.5 | 9,65 | 0,545 | 337000 | 0,0151 | 0,64 | 45,7 |
| 6a | 10420 | 0,8 | Yu. | ø 0.64 | 8,99 | 0,64 | 369000 | 0,0149 | 0 | 0,9 |
| 7 | 10420 | 3,2 | 5 | 0.53 x 1.06 | 5,15 | 0,707 | 234000 | 0.0312 x n | 2,5 | 44,2 |
| Total losses: 185 Note. For brick channels with an absolute roughness of 4 mm and U f = 6.15 m/s, correction factor n = 1.94 (Table 22.12.). |
||||||||||
The air ducts are made of galvanized sheet steel, the thickness and dimensions of which correspond to app. N from . The material of the air intake shaft is brick. Adjustable gratings of the PP type with possible sections are used as air distributors: 100 x 200; 200 x 200; 400 x 200 and 600 x 200 mm, shade factor 0.8 and maximum outlet air velocity up to 3 m/s.
The resistance of the insulated intake valve with fully open blades is 10 Pa. The hydraulic resistance of the air heater installation is 100 Pa (according to a separate calculation). Filter resistance G-4 250 Pa. Silencer hydraulic resistance 36 Pa (according to acoustic calculation). Based on architectural requirements, rectangular ducts are designed.
Cross-sections of brick channels are taken according to Table. 22.7.
Coefficients of local resistances.
Section 1. RR grating at the exit with a section of 200 x 400 mm (calculated separately): 
Dynamic pressure: 
KMC gratings (Appendix 25.1) = 1.8.
Pressure drop in the grid: Δp - pD x KMC = 5.8 x 1.8 = 10.4 Pa.
Estimated fan pressure р: Δр vent = 1.1 (Δр air + Δр valve + Δр filter + Δр cal + Δр mute) = 1.1 (185 + 10 + 250 + 100 + 36) = 639 Pa.
Fan supply: L vent \u003d 1.1 x Lsyst \u003d 1.1 x 10420 \u003d 11460 m 3 / h.
Selected radial fan VTS4-75 No. 6.3, version 1: L = 11500 m 3 / h; Δr ven = 640 Pa (ventilation unit E6.3.090 - 2a), rotor diameter 0.9 x D pom, rotation speed 1435 min-1, electric motor 4A10054; N = 3 kW is installed on the same axis as the fan. Unit weight 176 kg.
Fan motor power test (kW): 
By aerodynamic performance fan n vent = 0.75. 
Table 2. Determination of local resistances
| No. of plots | Type of local resistance | Sketch | Angle α, deg. | Attitude | Rationale | KMS | ||
| F0/F1 | L 0 /L st | f pass / f st | ||||||
| 1 | Diffuser |  |
20 | 0,62 | - | - | Tab. 25.1 | 0,09 |
| Withdrawal |  |
90 | - | - | - | Tab. 25.11 | 0,19 | |
| Tee-pass |  |
- | - | 0,3 | 0,8 | App. 25.8 | 0,2 | |
| Σ | 0,48 | |||||||
| 2 | Tee-pass |  |
- | - | 0,48 | 0,63 | App. 25.8 | 0,4 |
| 3 | branch tee |  |
- | 0,63 | 0,61 | - | App. 25.9 | 0,48 |
| 4 | 2 outlets | 250 x 400 | 90 | - | - | - | App. 25.11 | |
| Withdrawal | 400x250 | 90 | - | - | - | App. 25.11 | 0,22 | |
| Tee-pass |  |
- | - | 0,49 | 0,64 | Tab. 25.8 | 0,4 | |
| Σ | 1,44 | |||||||
| 5 | Tee-pass |  |
- | - | 0,34 | 0,83 | App. 25.8 | 0,2 |
| 6 | Diffuser after fan |  |
h=0.6 | 1,53 | - | - | App. 25.13 | 0,14 |
| Withdrawal | 600x500 | 90 | - | - | - | App. 25.11 | 0,5 | |
| Σ | 0,64 | |||||||
| 6a | Confuser in front of the fan |  |
D g \u003d 0.42 m | Tab. 25.12 | 0 | |||
| 7 | Knee | 90 | - | - | - | Tab. 25.1 | 1,2 | |
| Louvre grille | Tab. 25.1 | 1,3 | ||||||
| Σ | 1,44 | |||||||
Krasnov Yu.S., "Ventilation and air conditioning systems. Design recommendations for industrial and public buildings", chapter 15. "Thermocool"
With this material, the editors of the journal “Climate World” continue to publish chapters from the book “Ventilation and air conditioning systems. Design recommendations for
water and public buildings.” Author Krasnov Yu.S.
Aerodynamic calculation of air ducts begins with drawing an axonometric diagram (M 1: 100), putting down the numbers of sections, their loads L (m 3 / h) and lengths I (m). The direction of the aerodynamic calculation is determined - from the most remote and loaded section to the fan. When in doubt, when determining the direction, all possible options are calculated.
The calculation starts from a remote section: the diameter D (m) of a round or the area F (m 2) of the cross section of a rectangular duct is determined:
The speed increases as you get closer to the fan.
According to Appendix H, the nearest standard values are taken from: D CT or (a x b) st (m).
Hydraulic radius of rectangular ducts (m):
where is the sum of the local resistance coefficients in the duct section.
Local resistances at the border of two sections (tees, crosses) are attributed to the section with a lower flow rate.
Local resistance coefficients are given in the appendices.
Scheme of the supply ventilation system serving the 3-storey administrative building
Calculation example
Initial data:
| No. of plots | supply L, m 3 / h | length L, m | υ rivers, m/s | section a × b, m |
υ f, m/s | D l ,m | Re | λ | kmc | losses in the section Δр, pa |
| outlet grating pp | 0.2 × 0.4 | 3,1 | - | - | - | 1,8 | 10,4 | |||
| 1 | 720 | 4,2 | 4 | 0.2 × 0.25 | 4,0 | 0,222 | 56900 | 0,0205 | 0,48 | 8,4 |
| 2 | 1030 | 3,0 | 5 | 0.25×0.25 | 4,6 | 0,25 | 73700 | 0,0195 | 0,4 | 8,1 |
| 3 | 2130 | 2,7 | 6 | 0.4×0.25 | 5,92 | 0,308 | 116900 | 0,0180 | 0,48 | 13,4 |
| 4 | 3480 | 14,8 | 7 | 0.4×0.4 | 6,04 | 0,40 | 154900 | 0,0172 | 1,44 | 45,5 |
| 5 | 6830 | 1,2 | 8 | 0.5×0.5 | 7,6 | 0,50 | 234000 | 0,0159 | 0,2 | 8,3 |
| 6 | 10420 | 6,4 | 10 | 0.6×0.5 | 9,65 | 0,545 | 337000 | 0,0151 | 0,64 | 45,7 |
| 6a | 10420 | 0,8 | Yu. | Ø0.64 | 8,99 | 0,64 | 369000 | 0,0149 | 0 | 0,9 |
| 7 | 10420 | 3,2 | 5 | 0.53×1.06 | 5,15 | 0,707 | 234000 | 0.0312×n | 2,5 | 44,2 |
| Total losses: 185 | ||||||||||
| Table 1. Aerodynamic calculation | ||||||||||
The air ducts are made of galvanized sheet steel, the thickness and dimensions of which correspond to app. N out. The material of the air intake shaft is brick. Adjustable gratings of the PP type with possible sections are used as air distributors: 100 x 200; 200 x 200; 400 x 200 and 600 x 200 mm, shade factor 0.8 and maximum outlet air velocity up to 3 m/s.
The resistance of the insulated intake valve with fully open blades is 10 Pa. The hydraulic resistance of the air heater installation is 100 Pa (according to a separate calculation). Filter resistance G-4 250 Pa. The hydraulic resistance of the muffler is 36 Pa (according to acoustic calculation). Based on architectural requirements, rectangular ducts are designed.
Cross-sections of brick channels are taken according to Table. 22.7.
Local resistance coefficients
Section 1. RR grating at the exit with a section of 200 × 400 mm (calculated separately):
| No. of plots | Type of local resistance | Sketch | Angle α, deg. | Attitude | Rationale | KMS | ||
| F0/F1 | L 0 /L st | f pass / f st | ||||||
| 1 | Diffuser |
 |
20 | 0,62 | - | - | Tab. 25.1 | 0,09 |
| Withdrawal |
 |
90 | - | - | - | Tab. 25.11 | 0,19 | |
| Tee-pass |
 |
- | - | 0,3 | 0,8 | App. 25.8 | 0,2 | |
| ∑ = | 0,48 | |||||||
| 2 | Tee-pass |
 |
- | - | 0,48 | 0,63 | App. 25.8 | 0,4 |
| 3 | branch tee |
 |
- | 0,63 | 0,61 | - | App. 25.9 | 0,48 |
| 4 | 2 outlets | 250×400 | 90 | - | - | - | App. 25.11 | |
| Withdrawal | 400×250 | 90 | - | - | - | App. 25.11 | 0,22 | |
| Tee-pass |
 |
- | - | 0,49 | 0,64 | Tab. 25.8 | 0,4 | |
| ∑ = | 1,44 | |||||||
| 5 | Tee-pass |
 |
- | - | 0,34 | 0,83 | App. 25.8 | 0,2 |
| 6 | Diffuser after fan |
 |
h=0.6 | 1,53 | - | - | App. 25.13 | 0,14 |
| Withdrawal | 600×500 | 90 | - | - | - | App. 25.11 | 0,5 | |
| ∑= | 0,64 | |||||||
| 6a | Confuser in front of the fan |
 |
D g \u003d 0.42 m | Tab. 25.12 | 0 | |||
| 7 | Knee | 90 | - | - | - | Tab. 25.1 | 1,2 | |
| Louvre grille | Tab. 25.1 | 1,3 | ||||||
| ∑ = | 1,44 | |||||||
| Table 2. Determination of local resistances | ||||||||
Krasnov Yu.S.,
1. Friction loss:
Ptr \u003d (x * l / d) * (v * v * y) / 2g,
z = Q* (v*v*y)/2g,
Permissible speed method
Note: the air flow rate in the table is given in meters per second
Using Rectangular Ducts
The head loss diagram shows the diameters of round ducts. If rectangular ducts are used instead, find their equivalent diameters using the table below.
Notes:
- If there is not enough space (for example, during reconstruction), choose rectangular ducts. As a rule, the width of the duct is 2 times the height).
Table of equivalent duct diameters
When the parameters of the air ducts are known (their length, cross section, air friction coefficient on the surface), it is possible to calculate the pressure loss in the system at the projected air flow.
The total pressure loss (in kg/sq.m.) is calculated using the formula:
where R is the pressure loss due to friction per 1 linear meter of the duct, l is the length of the duct in meters, z is the pressure loss due to local resistances (with a variable section).
1. Friction loss:
In a round duct, friction pressure losses P tr are calculated as follows:
Ptr \u003d (x * l / d) * (v * v * y) / 2g,
where x is the coefficient of friction resistance, l is the length of the duct in meters, d is the diameter of the duct in meters, v is the air flow velocity in m/s, y is the air density in kg/m3, g is the acceleration free fall(9.8 m/s2).
Note: If the air duct has not a round, but a rectangular cross section, the equivalent diameter must be substituted into the formula, which for an air duct with sides A and B is equal to: dequiv = 2AB/(A + B)
2. Losses due to local resistance:
Pressure losses due to local resistances are calculated according to the formula:
z = Q* (v*v*y)/2g,
where Q is the sum of the coefficients of local resistances in the section of the duct for which the calculation is made, v is the air flow velocity in m/s, y is the air density in kg/m3, g is the free fall acceleration (9.8 m/s2 ). The Q values are contained in tabular form.
Permissible speed method
When calculating the air duct network using the method of permissible speeds, the optimal air speed is taken as the initial data (see table). Then, the required cross-section of the duct and the pressure loss in it are considered.
The procedure for the aerodynamic calculation of air ducts according to the method of permissible speeds:
Draw a diagram of the air distribution system. For each section of the duct, indicate the length and amount of air passing in 1 hour.
We start the calculation from the most distant from the fan and the most loaded sections.
Knowing the optimal air velocity for a given room and the volume of air passing through the duct in 1 hour, we determine the appropriate diameter (or cross section) of the duct.
We calculate the pressure loss due to friction P tr.
According to the tabular data, we determine the sum of local resistances Q and calculate the pressure loss due to local resistances z.
The available pressure for the next branches of the air distribution network is determined as the sum of the pressure losses in the sections located before this branch.
In the process of calculation, it is necessary to sequentially link all the branches of the network, equating the resistance of each branch to the resistance of the most loaded branch. This is done with diaphragms. They are installed on lightly loaded sections of air ducts, increasing resistance.
Table of maximum air speed depending on duct requirements
Constant Head Loss Method
This method assumes a constant pressure loss per 1 linear meter of the duct. Based on this, the dimensions of the duct network are determined. The method of constant head loss is quite simple and is used at the stage of the feasibility study of ventilation systems:
Depending on the purpose of the room, according to the table of permissible air velocities, the speed on the main section of the duct is selected.
Based on the speed determined in paragraph 1 and on the basis of the design air flow, the initial pressure loss is found (per 1 m of the duct length). This is the diagram below.
The most loaded branch is determined, and its length is taken as the equivalent length of the air distribution system. Most often this is the distance to the farthest diffuser.
Multiply the equivalent system length by the head loss from step 2. The head loss at the diffusers is added to the value obtained.
Now, using the diagram below, determine the diameter of the initial duct coming from the fan, and then the diameters of the remaining sections of the network according to the corresponding air flow rates. In this case, the initial pressure loss is assumed to be constant.
Diagram for determining head loss and duct diameter 
The head loss diagram shows the diameters of round ducts. If rectangular ducts are used instead, find their equivalent diameters using the table below.
Notes:
If space permits, it is better to choose round or square ducts;
If there is not enough space (for example, during reconstruction), rectangular ducts are chosen. As a rule, the width of the duct is 2 times the height).
The table shows the height of the duct in mm horizontally, the vertical width, and the table cells contain equivalent duct diameters in mm.
Creating comfortable conditions for staying indoors is impossible without aerodynamic calculation of air ducts. Based on the data obtained, the diameter of the pipe section, the power of the fans, the number and characteristics of the branches are determined. Additionally, the power of the heaters, the parameters of the inlet and outlet openings can be calculated. Depending on the specific purpose of the rooms, the maximum allowable noise level, the frequency of air exchange, the direction and speed of flows in the room are taken into account.
Modern requirements for are prescribed in the Code of Rules SP 60.13330.2012. The normalized parameters of microclimate indicators in rooms for various purposes are given in GOST 30494, SanPiN 2.1.3.2630, SanPiN 2.4.1.1249 and SanPiN 2.1.2.2645. When calculating the indicators of ventilation systems, all provisions must be taken into account without fail.
Aerodynamic calculation of air ducts - algorithm of actions
The work includes several successive stages, each of which solves local problems. The data obtained is formatted in the form of tables, on the basis of which schematic diagrams and graphs are drawn up. The work is divided into the following stages:
- Development of an axonometric diagram of air distribution throughout the system. On the basis of the scheme, a specific calculation method is determined, taking into account the features and tasks of the ventilation system.
- An aerodynamic calculation of air ducts is performed both along the main lines and along all branches.
- Based on the data obtained, a geometric shape and cross-sectional area of air ducts are determined technical specifications fans and heaters. Additionally, the possibility of installing fire extinguishing sensors, preventing the spread of smoke, the possibility of automatically adjusting the ventilation power, taking into account the program compiled by users, is taken into account.
Development of a ventilation system scheme
Depending on the linear parameters of the scheme, a scale is selected, the spatial position of the air ducts, points of attachment of additional technical devices, existing branches, places of air supply and intake are indicated on the diagram.

The diagram indicates the main line, its location and parameters, connection points and technical characteristics of the branches. Features of the location of the air ducts take into account the architectural characteristics of the premises and the building as a whole. When drawing up the supply scheme, the calculation procedure starts from the point farthest from the fan or from the room for which it is required to ensure the maximum air exchange rate. While compiling exhaust ventilation the main criterion is the maximum values for the air flow rate. The common line during the calculations is divided into separate sections, while each section must have the same cross-sections of air ducts, stable air consumption, identical materials fabrication and geometry of pipes.

The sections are numbered in sequence from the section with the lowest flow rate and ascending to the highest. Next, the actual length of each individual section is determined, the individual sections are summed up and the total length of the ventilation system is determined.

When planning the ventilation scheme, they can be taken as common for such premises:
- residential or public in any combination;
- industrial, if they belong to group A or B according to the fire category and are located on no more than three floors;
- one of the categories industrial buildings categories B1 - B4;
- categories of industrial buildings B1 and B2 can be connected to one ventilation system in any combination.
If the ventilation systems completely lack the possibility of natural ventilation, then the scheme should provide for the mandatory connection of emergency equipment. The power and installation location of additional fans are calculated according to general rules. For premises with openings that are constantly open or open if necessary, the scheme can be drawn up without the possibility of a backup emergency connection.
Systems for exhausting polluted air directly from technological or working areas must have one backup fan; the device can be put into operation automatically or manually. The requirements apply to working areas of the 1st and 2nd hazard classes. It is allowed not to provide a backup fan on the installation diagram only in the following cases:
- Synchronous stop harmful production processes in case of malfunction of the ventilation system.
- Separate emergency ventilation with its own air ducts is provided in the production premises. The parameters of such ventilation must remove at least 10% of the volume of air provided by stationary systems.
The ventilation scheme should provide for a separate possibility of showering in the workplace with increased levels of air pollution. All sections and connection points are indicated on the diagram and are included in the general calculation algorithm.
It is forbidden to place receiving air devices closer than eight meters horizontally from garbage dumps, car parking places, roads with heavy traffic, exhaust pipes and chimneys. Reception air devices must be protected by special devices on the windward side. Resistance indicators protective devices taken into account during aerodynamic calculations common system ventilation.
Air flow pressure loss calculation Aerodynamic calculation of air ducts for air losses is done in order to right choice sections to ensure technical requirements system and fan power selection. Losses are determined by the formula:

R yd - the value of specific pressure losses in all sections of the duct;
P gr is the gravitational air pressure in vertical channels;
Σ l - the sum of the individual sections of the ventilation system.
The pressure loss is given in Pa, the length of the sections is determined in meters. If the movement of air flows in ventilation systems occurs due to the natural pressure difference, then the calculated pressure drop Σ = (Rln + Z) for each individual section. To calculate the gravitational pressure, you need to use the formula:
P gr – gravitational pressure, Pa;
h is the height of the air column, m;
ρ n - air density outside the room, kg / m 3;
ρ in - air density inside the room, kg / m 3.
Further calculations for natural ventilation systems are performed using the formulas:
Determining the cross section of ducts
Determination of the speed of movement of air masses in gas ducts
Calculation for losses due to local resistances of the ventilation system
Determination of loss to overcome friction
Determination of the air flow velocity in the channels
The calculation begins with the most extended and remote section of the ventilation system. As a result of aerodynamic calculations of air ducts, the required mode of ventilation in the room should be provided.

The cross-sectional area is determined by the formula:
F P = L P / V T .
F P - cross-sectional area of the air channel;
L P is the actual air flow in the calculated section of the ventilation system;
V T - the speed of movement of air flows to ensure the required frequency of air exchange in the required volume.
Taking into account the results obtained, the pressure loss is determined during the forced movement of air masses through the air ducts.


Correction coefficients are applied for each material for the manufacture of air ducts, depending on the indicators of surface roughness and the speed of movement of air flows. Tables can be used to facilitate aerodynamic calculations of air ducts.
Tab. No. 1. Calculation of metal air ducts of a round profile.

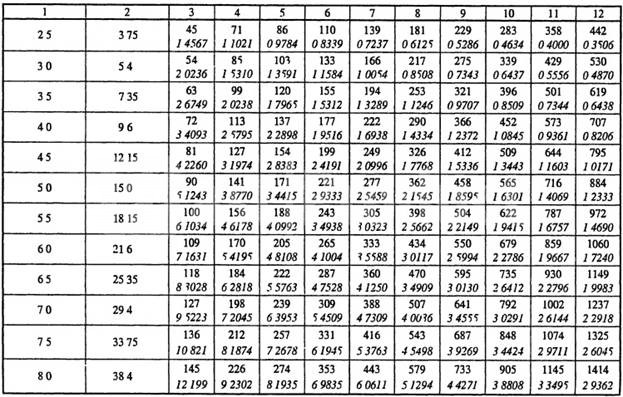


Table number 2. Values of correction factors taking into account the material of manufacture of air ducts and the speed of the air flow.
The roughness coefficients used for calculations for each material depend not only on its physical characteristics, but also on the speed of air flow. The faster the air moves, the more resistance it experiences. This feature must be taken into account during the selection of a specific coefficient.
Aerodynamic calculation for air flow in square and round ducts shows different flow rates for the same cross-sectional area conditional pass. This is explained by differences in the nature of vortices, their significance and ability to resist movement.
The main condition for the calculations is that the air velocity constantly increases as the area approaches the fan. With this in mind, requirements are imposed on the diameters of the channels. In this case, the parameters of air exchange in the premises must be taken into account. The locations of the inflow and outlet of the flows are selected in such a way that people staying in the room do not feel drafts. If a direct section fails to achieve a regulated result, then diaphragms are inserted into the air ducts with through holes. By changing the diameter of the holes, an optimal adjustment of the air flows is achieved. Diaphragm resistance is calculated by the formula:

The overall calculation of ventilation systems should take into account:
- Dynamic pressure of the air flow during movement. The data are consistent with the terms of reference and serve as the main criterion during the selection of a particular fan, its location and principle of operation. If it is impossible to provide the planned modes of operation of the ventilation system with one unit, several units are installed. The specific place of their installation depends on the features of the air duct circuit diagram and the permissible parameters.
- The volume (flow rate) of air masses moved in the context of each branch and room per unit of time. Initial data - the requirements of the sanitary authorities for the cleanliness of the premises and features technological process industrial enterprises.
- The inevitable pressure losses resulting from vortex phenomena during the movement of air flows on various speeds. In addition to this parameter, the actual cross-section of the duct and its geometric shape are taken into account.
- Optimum speed of air movement in the main channel and separately for each branch. The indicator affects the choice of fan power and their installation locations.
To facilitate the production of calculations, it is allowed to use a simplified scheme; it is used for all premises with non-critical requirements. To guarantee the required parameters, the selection of fans by power and quantity is done with a margin of up to 15%. A simplified aerodynamic calculation of ventilation systems is performed according to the following algorithm:
- Determination of the cross-sectional area of the channel depending on the optimal speed of the air flow.
- The choice of approximate to the calculated standard section channel. Specific indicators should always be selected upwards. Air ducts may have increased technical indicators, it is prohibited to reduce their capabilities. If it is impossible to select standard channels in specifications their production according to individual sketches is envisaged.
- Checking the indicators of air movement speed, taking into account the actual values of the nominal section of the main channel and all branches.
The task of aerodynamic calculation of air ducts is to provide the planned indicators of ventilation of premises with minimal loss of financial resources. At the same time, at the same time, it is necessary to achieve a reduction in the labor intensity and metal consumption of construction and installation works, ensuring the reliability of the operation of the installed equipment in various modes.
Special equipment should be mounted in accessible places, it should be freely accessible for routine maintenance. technical inspections and other works to maintain the system in working order.
According to the provisions of GOST R EN 13779-2007 for calculating the ventilation efficiency ε v you need to apply the formula:
with EHA- indicators of the concentration of harmful compounds and suspended solids in the exhaust air;
with IDA- the concentration of harmful chemical compounds and suspended solids in the room or working area;
c sup- indicators of pollution coming from the supply air.
The efficiency of ventilation systems depends not only on the power of the connected exhaust or blowing devices, but also on the location of air pollution sources. During the aerodynamic calculation, minimum performance indicators for the system should be taken into account.
Specific power (P Sfp > W∙s / m 3) of fans is calculated by the formula:
de P is the power of the electric motor installed on the fan, W;
q v - air flow rate supplied by fans during optimal operation, m 3 / s;
∆ p is an indicator of the pressure drop at the inlet and outlet of air from the fan;
η tot is the overall efficiency for the electric motor, air fan and air ducts.
During calculations, the following types of air flows are taken into account according to the numbering on the diagram:
Scheme 1. Types of air flows in the ventilation system.

- External, enters the air conditioning system from the external environment.
- Supply. Air flows into the duct system after pre-training(heating or cleaning).
- The air in the room.
- flowing air currents. Air moving from one room to another.
- Exhaust. Air vented from a room to the outside or into a system.
- Recirculation. Part of the flow returned to the system to maintain the internal temperature at setpoints.
- Removable. Air that is expelled from the premises irrevocably.
- secondary air. Returns back to the room after cleaning, heating, cooling, etc.
- Air loss. Possible leaks due to leaky air duct connections.
- Infiltration. The process of entering the air into the premises in a natural way.
- Exfiltration. Natural air leakage from the room.
- Air mixture. Simultaneous suppression of several streams.
Each type of air has its own state standards. All calculations of ventilation systems must take them into account.
You can also use the approximate formula:
0.195 v 1.8
R f . (10) d 100 1 , 2
Its error does not exceed 3 - 5%, which is sufficient for engineering calculations.
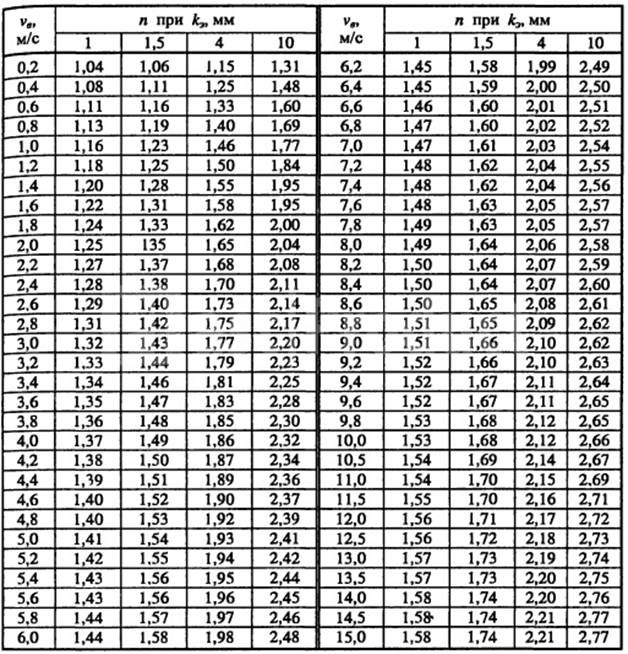
The total friction pressure loss for the entire section is obtained by multiplying the specific losses R by the length of the section l, Rl, Pa. If air ducts or channels from other materials are used, it is necessary to introduce a correction for roughness βsh according to Table. 2. It depends on the absolute equivalent roughness of the duct material K e (Table 3) and the value of v f .
table 2 |
|||||
Correction values βsh |
|||||
v f , m/s |
βsh at K e , mm |
||||
Table 3 Absolute equivalent roughness of duct material
Plasterer- |
||||||
ka on the grid |
||||||
K e , mm |
For steel air ducts βsh = 1. More detailed values of βsh can be found in Table. 22.12. With this correction in mind, the adjusted friction pressure loss Rl βsh , Pa, is obtained by multiplying Rl by the value βsh . Then determine the dynamic pressure on the participants
under standard conditions ρw = 1.2 kg/m3.
Next, local resistances are detected on the site, the coefficients of local resistance (LMR) ξ are determined and the sum of the LMR in this section (Σξ) is calculated. All local resistances are entered into the statement in the following form.

STATEMENT KMS VENTILATION SYSTEMS
Etc.
AT the column “local resistances” records the names of the resistances (bend, tee, cross, elbow, grate, air distributor, umbrella, etc.) available in this area. In addition, their number and characteristics are noted, according to which the CMR values are determined for these elements. For example, for a round bend, this is the angle of rotation and the ratio of the radius of rotation to the diameter of the duct r / d , for a rectangular outlet - the angle of rotation and dimensions of the sides of the duct a and b . For side openings in an air duct or duct (for example, at the installation site of an air intake grille) - the ratio of the opening area to the cross section of the air duct
f resp / f about . For tees and crosses on the passage, the ratio of the cross-sectional area of the passage and the trunk f p / f s and the flow rate in the branch and in the trunk L o / L s is taken into account, for tees and crosses on the branch - the ratio of the cross-sectional area of the branch and the trunk f p / f s and again, the value of L about /L with. It should be borne in mind that each tee or cross connects two adjacent sections, but they refer to one of these sections, in which the air flow L is less. The difference between tees and crosses on a run and on a branch has to do with how the design direction runs. This is shown in fig. 11. Here, the calculated direction is shown by a thick line, and the directions of air flows are shown by thin arrows. In addition, it is signed exactly where in each option the trunk, passage and exit are located.
branching of the tee for the correct choice of relations fp /fc , fo /fc and L o /L c . Note that in supply ventilation systems, the calculation is usually carried out against the movement of air, and in exhaust systems, along this movement. The sections to which the considered tees belong are indicated by checkmarks. The same applies to crosses. As a rule, although not always, tees and crosses on the passage appear when calculating the main direction, and on the branch they appear when aerodynamic linking of secondary sections (see below). In this case, the same tee in the main direction can be considered as a tee per passage, and in the secondary
– as a branch with a different coefficient. KMS for crosses

accepted in the same size as for the corresponding tees.
Rice. 11. Tee calculation scheme
Approximate values of ξ for common resistances are given in Table. 4.
Table 4 |
||||
Values ξ of some local resistances |
||||
Name |
Name |
|||
resistance |
resistance |
|||
Elbow round 90o, |
The grate is not adjustable |
|||
r/d = 1 |
may RS-G (exhaust or |
|||
Rectangular elbow 90o |
air intake) |
|||
Tee in the passage (on- |
sudden expansion |
|||
oppression) |
||||
Branch tee |
sudden constriction |
|||
Tee in the passage (all- |
First side hole |
|||
stie (entrance to the air |
||||
Branch tee |
–0.5* … |
boron mine) |
||
Plafond (anemostat) ST-KR, |
Rectangular elbow |
|||
90o |
||||
Grille adjustable RS- |
Umbrella over exhaust |
|||
VG (supply) |
||||
*) negative CMR can occur at low Lo /Lc due to air ejection (suction) from the branch by the main flow.
More detailed data for the KMS are given in Table. 22.16 - 22.43. For the most common local resistances -

tees in the passage - KMR can also be approximately calculated using the following formulas:
0.41f "25L" 0.24 |
0.25 at |
0.7 and |
f "0.5 (11) |
|||||||
- for tees during injection (supply); |
||||||||||
at L" |
0.4 you can use the simplified formula |
|||||||||
prox int 0. 425 0. 25 f p "; |
||||||||||
0.2 1.7f" |
0.35 0.25f" |
2.4L" |
0. 2 2 |
|||||||
– for suction tees (exhaust).
Here L" |
f about |
and f" |
f p |
|||||||
f c |
||||||||||
After determining the value of Σξ, the pressure loss at local resistances Z P d, Pa, and the total pressure loss are calculated
on the section Rl βsh + Z , Pa.
The results of the calculations are entered in the table in the following form.
AERODYNAMIC CALCULATION OF THE VENTILATION SYSTEM
Estimated |
|||||||||||||||
Duct dimensions |
pressure |
||||||||||||||
on friction |
Rlβ w |
Rd , |
|||||||||||||
βw |
|||||||||||||||
d or |
f op, |
ff , |
Vf , |
d eq |
|||||||||||
l , m |
a×b |
||||||||||||||
When the calculation of all sections of the main direction is completed, the values of Rl βsh + Z for them are summarized and the total resistance is determined.
ventilation network resistance P network = Σ(Rl βw + Z ).
After calculating the main direction, one or two branches are linked. If the system serves several floors, you can select floor branches on intermediate floors for linking. If the system serves one floor, link branches from the main that are not included in the main direction (see the example in paragraph 4.3). The calculation of the linked sections is carried out in the same sequence as for the main direction, and recorded in a table in the same form. Linkage is considered completed if the amount

pressure loss Σ(Rl βsh + Z ) along the linked sections deviates from the sum Σ(Rl βsh + Z ) along parallel connected sections of the main direction by no more than 10%. Sections along the main and linked directions from the point of their branching to the end air distributors are considered to be connected in parallel. If the circuit looks like the one shown in Fig. 12 (the main direction is marked with a thick line), then direction 2 alignment requires that the value of Rl βsh + Z for section 2 be equal to Rl βsh + Z for section 1, obtained from the calculation of the main direction, with an accuracy of 10%. Linkage is achieved by selecting the diameters of round or cross-sectional dimensions of rectangular air ducts in the linked sections, and if this is not possible, by installing throttle valves or diaphragms on the branches.
The selection of a fan should be carried out according to the manufacturer's catalogs or according to the data. The fan pressure is equal to the sum of pressure losses in the ventilation network in the main direction, determined during the aerodynamic calculation of the ventilation system, and the sum of pressure losses in the elements of the ventilation unit (air damper, filter, air heater, silencer, etc.).
Rice. 12. A fragment of the scheme of the ventilation system with the choice of a branch for linking
Finally, you can choose a fan only after acoustic calculation when the issue of installing a silencer is decided. Acoustic calculation can be performed only after preliminary selection of the fan, since the initial data for it are the sound power levels emitted by the fan into the air ducts. Acoustic calculation is carried out, guided by the instructions of chapter 12. If necessary, calculate and determine the size of the silencer , , then finally select the fan.

4.3. An example of calculating the supply ventilation system
Under consideration supply system ventilation for the dining room. The application of air ducts and air distributors to the plan is given in clause 3.1 in the first version (typical diagram for halls).
System Diagram
1000х400 5 8310 m3/h
2772 m3/h2 |
|||||||
More details on the calculation methodology and the necessary initial data can be found at,. The corresponding terminology is given in .


STATEMENT OF KMS SYSTEM P1
local resistance |
||||||
924 m3/h |
||||||
1. Elbow round 90о r /d =1 |
||||||
2. Tee in the passage (pressure) |
||||||
fp / fc |
Lo/Lc |
|||||
fp / fc |
Lo/Lc |
|||||
1. Tee in the passage (pressure) |
||||||
fp / fc |
Lo/Lc |
|||||
1. Tee in the passage (pressure) |
||||||
fp / fc |
Lo/Lc |
|||||
1. Rectangular elbow 1000×400 90o 4 pcs |
||||||
1. Air intake shaft with umbrella |
||||||
(first side hole) |
||||||
1. Air intake louvre |
||||||
STATEMENT OF KMS OF THE P1 SYSTEM (Branch No. 1) |
||||||
local resistance |
||||||
1. Air distributor PRM3 at flow rate |
||||||
924 m3/h |
||||||
1. Elbow round 90о r /d =1 |
||||||
2. Branch tee (injection) |
||||||
fo / fc |
Lo/Lc |
|||||
APPENDIX Characteristics ventilation grilles and plafonds
I. Living sections, m2, supply and exhaust louvered gratings RS-VG and RS-G
Length, mm |
Height, mm |
|||||
Speed coefficient m = 6.3, temperature coefficient n = 5.1.
II. Characteristics of ceiling lamps ST-KR and ST-KV
Name |
Dimensions, mm |
f fact, m 2 |
||
Dimensional |
Interior |
|||
Plafond ST-KR |
||||
(round) |
||||
Plafond ST-KV |
||||
(square) |
||||
Speed coefficient m = 2.5, temperature coefficient n = 3.
REFERENCES
1. Samarin O.D. Selection of supply air equipment ventilation units(air conditioners) type KCKP. Guidelines for the implementation of course and diploma projects for students of the specialty 270109 "Heat and gas supply and ventilation". – M.: MGSU, 2009. – 32 p.
2. Belova E.M. Central systems air conditioning in buildings. - M.: Euroclimate, 2006. - 640 p.
3. SNiP 41-01-2003 "Heating, ventilation and air conditioning". - M.: GUP TsPP, 2004.
4. Catalog of equipment "Arktos".
5. sanitary devices. Part 3. Ventilation and air conditioning. Book 2. / Ed. N.N. Pavlov and Yu.I. Schiller. – M.: Stroyizdat, 1992. – 416 p.
6. GOST 21.602-2003. System of design documents for construction. Rules for the implementation of working documentation for heating, ventilation and air conditioning. - M.: GUP TsPP, 2004.
7. Samarin O.D. On the regime of air movement in steel air ducts.
// SOK, 2006, No. 7, p. 90-91.
8. Designer's Handbook. Internal sanitary devices. Part 3. Ventilation and air conditioning. Book 1. / Ed. N.N. Pavlov and Yu.I. Schiller. – M.: Stroyizdat, 1992. – 320 p.
9. Kamenev P.N., Tertichnik E.I. Ventilation. - M.: ASV, 2006. - 616 p.
10. Krupnov B.A. Terminology for building thermophysics, heating, ventilation and air conditioning: guidelines for students of the specialty "Heat and gas supply and ventilation".